20200611- EUR/CHF – easy come, easy go and back into the downtrend
Two days ago I wrote: “A break below this level (1.071) could mean the end to the current medim term uptrend. If the level holds, the 1.083 would need to be broken on the top to break out of the primary downtrend in place since April 2018.”
I am not sure if the FED’s bleak outlook on the US GDP or the generally overbought situation (indicated by the RSI) has been leading to the sell-off. Stock markets have been diving today as well.
But now the break has happened on the hourly EURCHF chart. The EURCHF broke below 1.071 and therefore completed a Head & Shoulders Formation giving a technical price target around 1.058 for the EURCHF.
Today the first support around 1.066 was reached if it doesn’t hold in the coming days there is potential to continue even down to 1.058. This will surely depend o how the current market recovery will be continue.
This is no investment advice. The author currently holds a position in the EURCHF.
EURCHF Chart hourly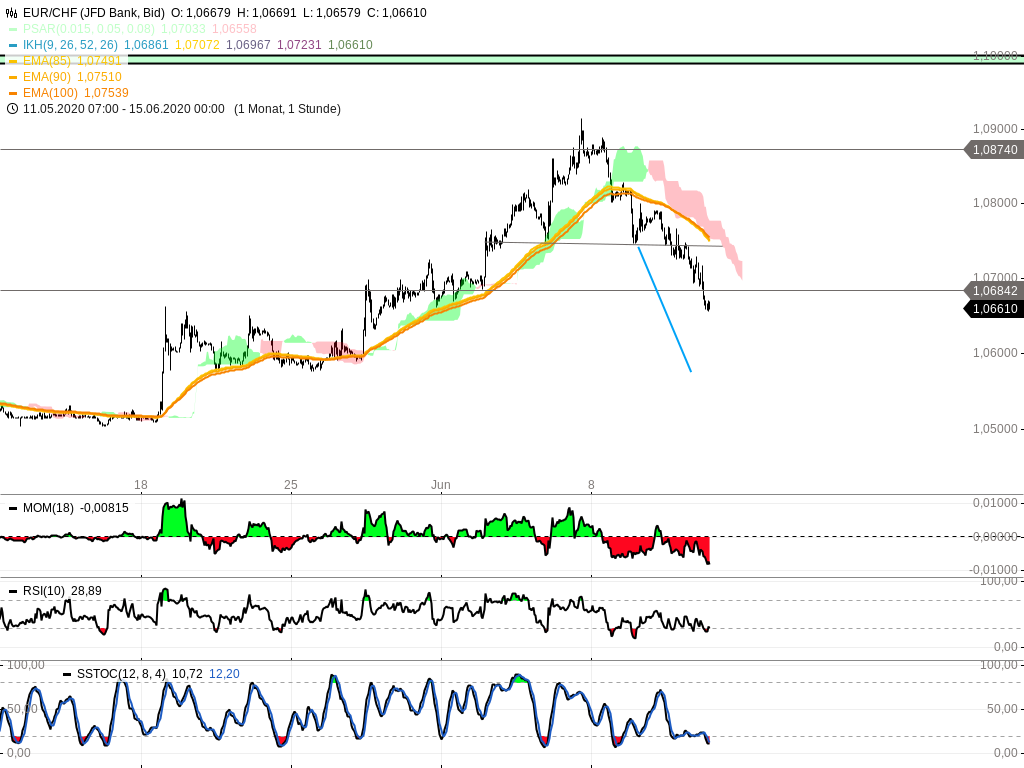
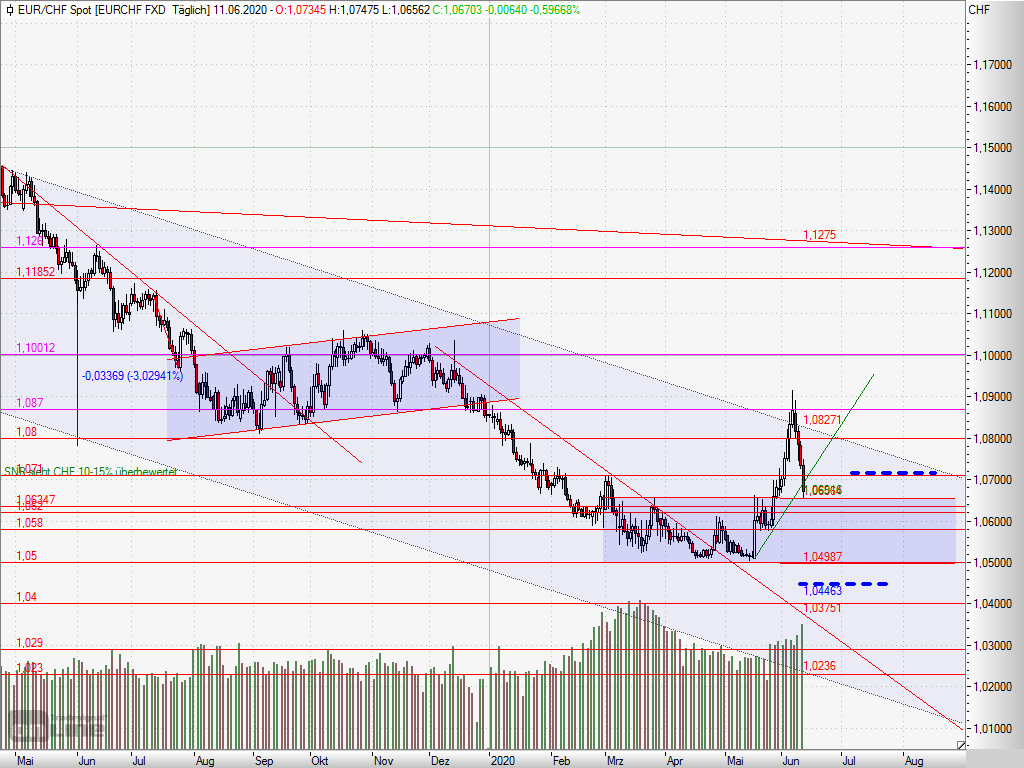
EURCHF Chart daily